Key points about quadratic inequalities

A Describing an expression of the form 𝑎𝑥² + 𝑏𝑥 + 𝑐, where 𝑎, 𝑏 and 𝑐 are integers.A relationship between two expressions or values that are not equal. can be solved by factorising or using the Used to solve a quadratic equation in the form 𝑎𝑥² + 𝑏𝑥 + 𝑐 . The values 𝑎, 𝑏 and 𝑐 are substituted into the formula. .
The solution to a quadratic inequality may be presented:
- as a single inequality, between two values
- as two separate inequalities
- on a A line on which numbers are marked at equal intervals.
- listed as an integer solution, or For a solution where 𝑥 = 3, 4 or 5, this is written as 𝑥 = {3, 4, 5}. The curly brackets contain the solution list.
- graphically
It's important to remember that a A value whose square is equal to a given number, eg one square root of 25 is 5 since 5² = 25. The square root of 25 is recorded as √25 = 5. However, as well as a positive square root, 25 has a negative square root, since (– 5)² = 25. has both positive and negative solutions. For example, √25 equals 5 and –5; and while – 6 is less than –5, (–6)² = 36 is greater than (–5)² = 25.
The roots and 𝑦-The 𝑦-intercept is where a graph crosses the 𝑦-axis. The 𝑥-intercepts are where a graph crosses the 𝑥-axis. For a quadratic graph, the 𝑥-intercepts are the roots (or solutions) to the equation 𝑎𝑥² + 𝑏𝑥 + 𝑐 = 0. help to sketch a quadratic equation and to solve a quadratic inequality. The direction of the inequality identifies the part of the graph that represents the solution.
Make sure you know how to solve quadratic equations to boost your confidence in this topic. Understanding how to sketch quadratic graphs is also helpful.
Video – Solving quadratic inequalities
Watch this video to learn more about solving quadratic inequalities.
Inequalities compare expressions or terms. The expressions can be quadratic, which means the highest power of 𝑥 is 2.
Tom: How do you solve quadratic inequalities?
Inequalities compare expressions or terms.
They tell us which one is greater or smaller and whether they can be equal.
The expressions within inequalities can be quadratic, which means the highest power of 𝑥 is 2.
For example, 𝑥 squared add 𝑥 is greater than 6.
Just like solving a quadratic equation, the first step in solving a quadratic inequality is to re-arrange so that all the terms are on one side of the inequality.
Subtracting 6 from both sides gives 𝑥 squared add 𝑥 subtract 6 is greater than 0.
To solve the inequality, first find when this expression equals 0.
So, factorise into two brackets and then find when each bracket is equal to 0.
Doing this tells you that 𝑥 equals –3 or 𝑥 equals 2.
But we're not done yet!
You still need to find the solution to the inequality.
To do this, sketch the graph of the quadratic equation y equals 𝑥 squared add 𝑥 subtract 6.
Since the 𝑥-squared term has a positive coefficient, the graph has a U-shape, and we know it crosses the 𝑥-axis when y equals 0 at the two roots, –3 and 2.
The ‘greater than’ symbol tells you that the inequality will be true for all values of 𝑥 that make the expression greater than 0, so that means the values of 𝑥 for which the graph is above the 𝑥-axis.
This is the case when 𝑥 is less than –3 or 𝑥 is greater than 2, so the solution to the inequality 𝑥 squared add 𝑥 is greater than 6 is 𝑥 is less than –3 or 𝑥 is greater than 2.
If the inequality symbol was ‘less than’ instead of ‘greater than’, then the inequality would be true for all values between –3 and 2, where the graph is below the 𝑥-axis.
So the solution would be 𝑥 is greater than –3, but less than 2.
Let's recap.
To solve the quadratic inequality, first re-arrange so that the expression is greater than or less than 0.
Then, replace the inequality symbol with an equals sign so that the expression equals 0 and solve to find the root.
Finally, sketch the graph and consider the inequality symbol to decide which sections of the graph are needed.
If the inequality is true for values of 𝑥 either side of the roots, the solution will be two separate inequalities.
If the inequality is true for values of 𝑥 between the roots, the solution will be a double inequality, so it will be written in one line.
Check your understanding
How to sketch a quadratic graph
Sketching a quadratic graph from a quadratic inequality
Rearrange the inequality, if necessary, to be in the form 𝑎𝑥² + 𝑏𝑥 + 𝑐 < 0 ( or ≤ 0 or > 0 ≥ 0).
Next, sketch the graph 𝑦 = 𝑎𝑥² + 𝑏𝑥 + 𝑐. The graph is U-shaped.
Solve the equation 𝑎𝑥² + 𝑏𝑥 + 𝑐 = 0 by To express a number or expression as the product of its factors. For example, the number 6 can be factorised as 2 × 3, and 6𝑛 – 12 can be factorised as 6(𝑛 – 2). or using the formula to find the roots, 𝑥₁ and 𝑥₂.
These values are where the graph crosses the 𝑥-axis, and 𝑥₁ and 𝑥₂ are the 𝑥 intercepts.
- The 𝑦-intercept is the value of 𝑐. This is where the graph crosses the 𝑦-axis.
- Given the shape of the graph and the intercepts, the graph can be sketched.
When solving a quadratic inequality, the sketch of the quadratic graph includes the value of the Although this can be a general reference to any root such as a square root, cube root, 4th root and so on, this can also refer to the solution or solutions to an equation. That is the value or values of 𝑥 for which 𝑎𝑥² + 𝑏𝑥 + 𝑐 = 0. , 𝑥-intercepts, to help identify the inequality solution.
The 𝑦-intercept is not essential in the sketch.
Follow the worked example below
GCSE exam-style questions

- Sketch the quadratic graph that will help to explain the solution to the quadratic inequality.
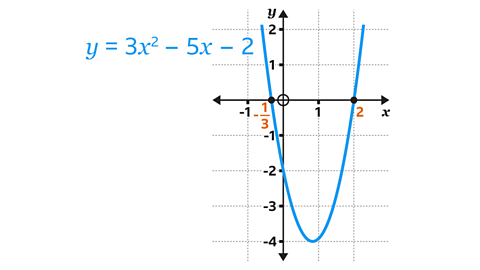
The graph 𝑦 = 3𝑥² – 5𝑥 – 2 crosses the 𝑦-axis at –2 and the 𝑥-axis at \(\frac{–1}{3} \) and 2.
The quadratic is already in the form 𝑎𝑥² + 𝑏𝑥 + 𝑐 > 0 and does not need to be re-arranged.
The quadratic graph that needs to be sketched is
𝑦 = 3𝑥² – 5𝑥 – 2.
Factorise 3𝑥² – 5𝑥 – 2 = 0.
(3𝑥 + 1)(𝑥 – 2) = 0Solve for 𝑥.
(3𝑥 + 1) = 0 , (𝑥 – 2) = 0
𝑥 = \(\frac{–1}{3} \), 𝑥 = 2
The graph 𝑦 = 3𝑥² – 5𝑥 – 2 crosses the 𝑦-axis at –2 (0, –2) and the 𝑥-axis at \(\frac{–1}{3} \) (\(\frac{–1}{3} \), 0) and 2 (0, 2).
- Sketch the quadratic graph that will help to explain the solution to the quadratic inequality.
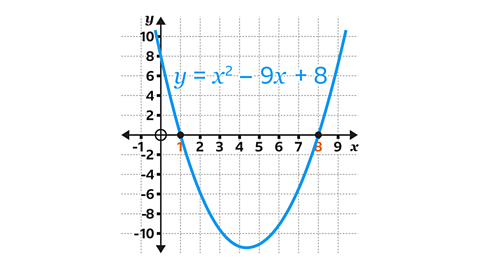
The graph 𝑦 = 𝑥² – 9𝑥 + 8 crosses the 𝑦-axis at 8 (0, 8) and the 𝑥-axis at 1 (1, 0) and 8 (8, 0).
- The inequality has a negative 𝑥² term. Re-arrange the inequality so that the 𝑥² term is positive:
9𝑥 – 𝑥² ≤ 8
- Add 𝑥² to both sides and subtract 8 from both sides.
This gives 0 ≤ 𝑥² – 9𝑥 + 8 which is the same as
𝑥² – 9𝑥 + 8 ≥ 0.
The quadratic graph that needs to be sketched is
𝑦 = 𝑥² – 9𝑥 + 8.
- Factorise 𝑥² – 9𝑥 + 8 = 0.
(𝑥 – 1)(𝑥 – 8) = 0
- Solve for 𝑥.
(𝑥 – 1) = 0, (𝑥 – 8) = 0
𝑥 = 1 and 𝑥 = 8.
The graph 𝑦 = 𝑥² – 9𝑥 + 8 crosses the 𝑦-axis at 8 (0, 8) and the 𝑥-axis at 1 (1, 0) and 8 (8, 0).
- Sketch the quadratic graph that will help to explain the solution to the quadratic inequality.
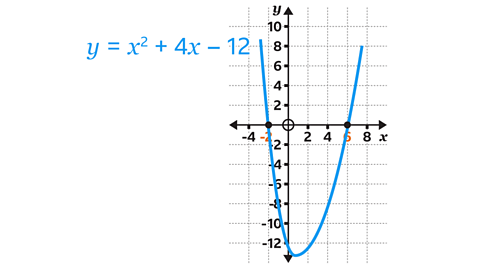
The graph 𝑦 = 𝑥² – 4𝑥 – 12 crosses the 𝑦-axis at –12 and the 𝑥-axis at –2 and 6.
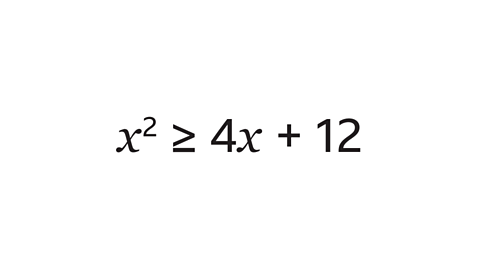
Rearrange the inequality 𝑥² ≥ 4𝑥 – 12 so that it is in the form 𝑎𝑥² + 𝑏𝑥 + 𝑐 > 0.
Subtract 4𝑥 and 12 from each side.
This gives 𝑥² – 4𝑥 – 12 ≥ 0.
The quadratic graph that needs to be sketched is
𝑦 = 𝑥² – 4𝑥 – 12.
- Factorise 𝑥² – 4𝑥 – 12 = 0.
(𝑥 – 6) (𝑥 + 2) = 0
- Solve for 𝑥.
(𝑥 – 6) = 0 and (𝑥 + 2) = 0
𝑥 = 6 and 𝑥 = –2
The graph 𝑦 = 𝑥² – 4𝑥 – 12 crosses the 𝑦-axis at –12
(0, –12) and the 𝑥-axis at 6 (6, 0) and –2 (–2, 0).
How to solve a quadratic inequality by factorising
A quadratic inequality can be written in the form 𝑎𝑥² + 𝑏𝑥 + 𝑐 < 0, where 𝑎, 𝑏 and 𝑐 are Numbers with no fraction or decimal part. They can be positive, negative or zero. 42, – 8 and 10,000 are examples of integers., and the inequality is < or ≤ or > or ≥.
- Factorising to solve a quadratic inequality uses the same steps as factorising a quadratic equation.
- Rearrange, if necessary, to 𝑎𝑥² + 𝑏𝑥 + 𝑐 < 0 ( or ≤ 0, or > 0, or ≥ 0).
- Factorise the quadratic 𝑎𝑥² + 𝑏𝑥 + 𝑐 = 0.
- Find the roots 𝑥₁ and 𝑥₂ (the values of 𝑥 for which each bracket = 0).
Sketch the quadratic graph to verify the solution to the quadratic inequality.
Show the solutions of the inequality.
For inequality < or ≤, the solutions lie between the two roots 𝑥₁ and 𝑥₂.
- The solution is written as a single inequality. 𝑥₁ < 𝑥 < 𝑥₂ or 𝑥₁ ≤ 𝑥 ≤ 𝑥₂.
- The solution can be shown on a number line.
- The integer solutions can be listed (< the roots are not included, ≤ the roots are included).
For inequality > or ≥, the solutions lie below and above the two roots 𝑥₁ and 𝑥₂.
- The solution is two separate inequalities. 𝑥 < 𝑥₁ and 𝑥 > 𝑥₂ or 𝑥 ≤ 𝑥₁ and 𝑥 ≥ 𝑥₂.
- This solution can be shown on a number line.
- The integer solutions cannot be listed as there is an infinite number of possibilities.
Follow the worked example below
GCSE exam-style questions
- Solve the inequality and list the integer solution in set notation.
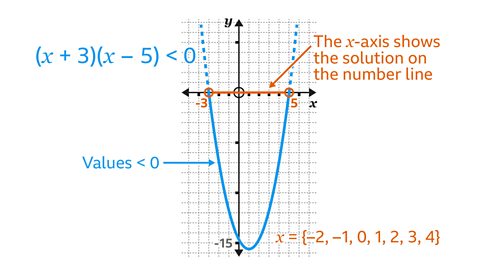
𝑥 = { –2, –1, 0, 1, 2, 3, 4}
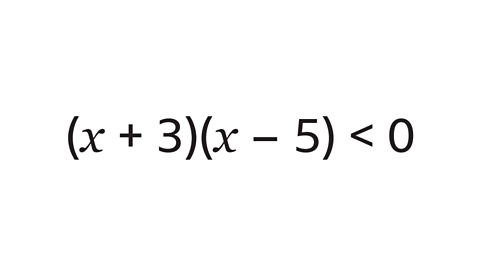
The inequality has already been factorised:
(𝑥 + 3) (𝑥 – 5) < 0
Sketch the graph 𝑦 = (𝑥 + 3) (𝑥 – 5).
Solve (𝑥 + 3) (𝑥 – 5) = 0 for 𝑥.
(𝑥 + 3) = 0 and (𝑥 – 5) = 0
𝑥 = –3 and 𝑥 = 5
The graph 𝑦 = (𝑥 + 3) (𝑥 – 5) crosses the 𝑥-axis at –3 and 5.
The graph crosses the 𝑦-axis at –15 (this does not have to be shown on the sketch as it is not essential for solving the inequality).
The solutions where 𝑦 < 0 lie between the two roots.
The roots ( –3 and 5) are not included.
This is shown by the empty circles at –3 and 5.
The integer solutions are –2, –1, 0, 1, 2, 3, 4.
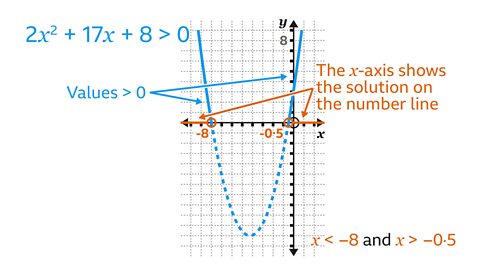
- Solve the inequality 2𝑥² + 17𝑥 + 8 > 0.
The solution is written as two inequalities:
𝑥 < –8 and 𝑥 > –0·5.
The inequality 2𝑥² + 17𝑥 + 8 > 0 is already in the form of 𝑎𝑥² + 𝑏𝑥 + 𝑐 > 0.
- Factorise 2𝑥² + 17𝑥 + 8.
2𝑥² + 17𝑥 + 8 = (2𝑥 + 1)(𝑥 +8)
- Solve (2𝑥 + 1)(𝑥 +8) = 0 for 𝑥.
(2𝑥 + 1) = 0, (𝑥 +8) = 0
𝑥 = –0·5 and 𝑥 = –8
The graph 𝑦 = (2𝑥 + 1)(𝑥 +8) (also 𝑦 = 2𝑥² + 17𝑥 + 8) crosses the 𝑥-axis at –0·5 and –8.
The graph crosses the 𝑦-axis at 8. This does not have to be shown on the sketch as it is not essential for solving the inequality.
The solutions where 𝑦 > 0 lie below and above the two roots. The roots ( –8 and –0·5) are not included. This is shown by the empty circles at
–8 and –0·5.
The solution is written as two inequalities.
𝑥 < –8 and 𝑥 > –0·5
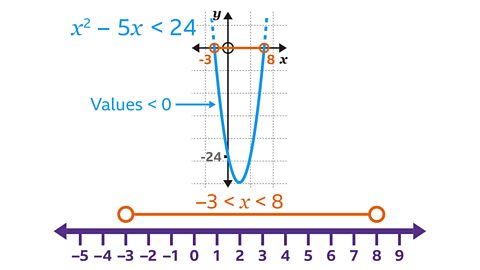
- Show the solution to 𝑥² – 5𝑥 < 24 on a number line.

- Rearrange the inequality 𝑥² – 5𝑥 < 24 so that it is in the form 𝑥² + 𝑏𝑥 + 𝑐 < 0.
Do this by subtracting 24 from each side of the inequality.
The inequality is now 𝑥² – 5𝑥 – 24 < 0
- Now factorise 𝑥² – 5𝑥 – 24.
𝑥² – 5𝑥 – 24 = (𝑥 + 3)(𝑥 – 8)
The graph that needs to be sketched is 𝑦 = 𝑥² – 5𝑥 – 24.
- Solve (𝑥 + 3)(𝑥 – 8) = 0 for 𝑥.
(𝑥 + 3) = 0, (𝑥 – 8) = 0
𝑥 = –3, 𝑥 = 8
The graph 𝑦 = 𝑥² – 5𝑥 – 24, also 𝑦 = (𝑥 + 3)(𝑥 – 8), crosses the 𝑥-axis at –3 and 8.
The graph crosses the 𝑦-axis at –24. This does not have to be shown on the sketch as it is not essential for solving the inequality.
The solutions where 𝑦 < 0 lie between the two roots.
The roots are –3 and 8 are not included.
This is shown by the empty circles at –3 and 8.
- Write the solution as a single inequality. –3 < 𝑥 < 8.
This can also be presented on a number line.
The circles at –3 and 8 are empty as –3 and 8 are not included in the solution.
How to solve a quadratic inequality using the quadratic formula
A quadratic inequality can be written in the form 𝑎𝑥² + 𝑏𝑥 + 𝑐 < 0, where 𝑎, 𝑏 and 𝑐 are integers, and the inequality is < or ≤ or > or ≥.
Using the quadratic formula to solve a quadratic inequality uses the same steps as solving a quadratic equation.
Rearrange, if necessary, to 𝑎𝑥² + 𝑏𝑥 + 𝑐 < 0 ( or ≤ 0, or > 0, or ≥ 0) and use the quadratic formula to solve the quadratic equation 𝑎𝑥² + 𝑏𝑥 + 𝑐 = 0.
Identify the values of the integers 𝑎, 𝑏 and 𝑐.
Substitute the integers 𝑎, 𝑏 and 𝑐 into the formula 𝑥 = \(\frac{–𝑏 ± √(𝑏² – 4𝑎𝑐)}{2𝑎} \)
i) Place brackets around any negative values to make sure the calculation is processed correctly.
The formula will give the root(s) (𝑥₁ and 𝑥₂) for the equation 𝑎𝑥² + 𝑏𝑥 + 𝑐 = 0.
- Use the roots 𝑥₁ and 𝑥₂ to write the solution as an inequality.
i) For quadratics < 0 or ≤ 0, the solution is a single inequality between the two roots.
𝑥₁ < 𝑥 < 𝑥₂ or 𝑥₁ ≤ 𝑥 ≤ 𝑥₂
This solution can be shown on a number line.
The integer solutions can be listed.
ii) For quadratics > 0 or ≥ 0, the solution is two separate inequalities.
𝑥 < 𝑥₁ and 𝑥 > 𝑥₂ or 𝑥 ≤ 𝑥₁ and 𝑥 ≥ 𝑥₂
This solution can be shown on a number line.
The integer solutions cannot be listed as there is an infinite number of possibilities.
Follow the worked example below
GCSE exam-style questions
- The roots of the equation 𝑥² – 5𝑥 + 2 = 0 are 0·44 and 4·56.
The graph shows the solution to a quadratic inequality.
What inequality has been solved?
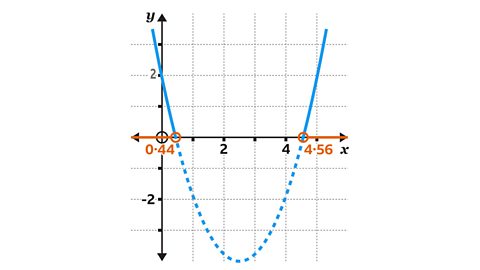
The graph shows the solution to 𝑥² – 5𝑥 + 2 > 0.
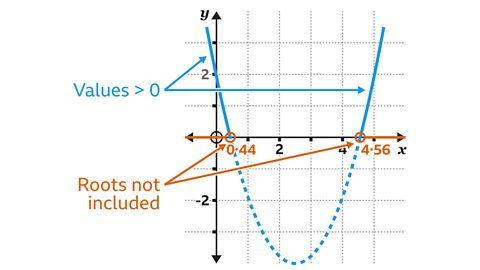
The solution shown is 𝑥 < 0·44 and 𝑥 > 4·56.
The empty circles show that the roots are not included in the solution.
The solutions lie beyond the roots, the values of 𝑦 are greater than zero.
The graph shows the solution to 𝑥² – 5𝑥 + 2 > 0.
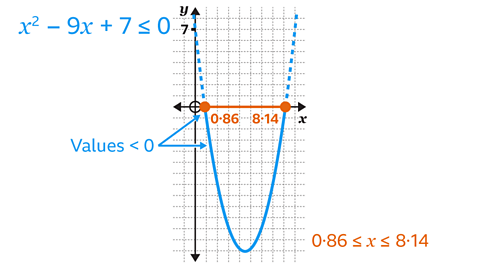
- Solve the inequality 𝑥² – 9𝑥 + 7 ≤ 0.
Write the solution as an inequality.
0·86 ≤ 𝑥 ≤ 8·14
The inequality is already in the form 𝑎𝑥² + 𝑏𝑥 + 𝑐 > 0,
𝑥² – 9𝑥 + 7 ≤ 0.
Solve the equation 𝑥² – 9𝑥 + 7 = 0 by using the quadratic formula.
- First, identify the values of the integers 𝑎, 𝑏 and 𝑐.
𝑎 = 1, 𝑏 = – 9 and 𝑐 = 7.
- Substitute the integers 1, – 9 and 7 into the formula
𝑥 = \(\frac{–𝑏 ± √(𝑏² – 4𝑎𝑐)}{2𝑎} \).
- Place brackets around the negative value (– 9) to make sure the calculation is processed correctly.
𝑥 = \(\frac{9 ± √((– 9²) – 4×1×7)}{2×1} \)
This shows the roots are 0·86 and 8·14.
Sketch the graph, the 𝑥-intercepts (the roots, 0·86 and 8·14) are where the curve crosses the 𝑥-axis.
The solution for 𝑥² – 9𝑥 + 7 ≤ 0 lies between the roots.
These are included as the inequalities are ≤.
- Solve the quadratic inequality 0 ≤ 2 – 4𝑥² – 9𝑥.
List the integer solution in set notation.
The solution is –2∙5 ≤ 𝑥 ≤ 0∙2.
The integer solution is 𝑥 = {–2, –1, 0}.
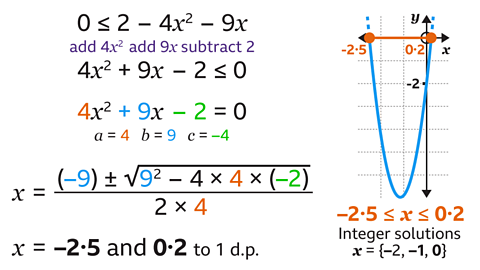
Rearrange the inequality so that the 𝑥² term is positive.
Add 4𝑥² and 9𝑥 to each side and subtract 2 from each side.
This gives 4𝑥² + 9𝑥 – 2 ≤ 0.
- Next use the quadratic formula for the equation
4𝑥² + 9𝑥 – 2 = 0.
Identify the values of the integers 𝑎, 𝑏 and 𝑐.
𝑎 = 4, 𝑏 = 9 and 𝑐 = –2
- Substitute the integers 4, 9 and –2 into the formula.
𝑥 = \(\frac{–𝑏 ± √(𝑏² – 4𝑎𝑐)}{2𝑎} \)
- Place brackets around the negative value (–2) to make sure the calculation is processed correctly.
𝑥 = \(\frac{–9 ± √(9² – 4×4×(–2)}{2×4} \)
This shows the roots are –2·5 and 0·2.
Sketch the graph, (𝑦 = 4𝑥² + 9𝑥 – 2), the 𝑥-intercepts (the roots, –2·5 and 0·2) are where the curve crosses the 𝑥-axis.
The solutions for 4𝑥² + 9𝑥 – 2 ≤ 0 lie between the roots.
These are included as the inequalities are ≤.
Quiz – Quadratic inequalities
Practise what you've learned about quadratic inequalities with this quiz.
Now you've revised quadratic inequalities, why not look at graphs of inequalities?
More on Algebra
Find out more by working through a topic
- count16 of 17

- count17 of 17
- count2 of 17